isolining package for ActionScript 3

A week or so back I wrote about a package I ported/modified to create the Delaunay triangulation in Flash with a few AS3 classes. As I noted there, such a triangulated irregular network (TIN) allows us to interpolate isolines — lines of constant value (aka isarithms, commonly called contours).

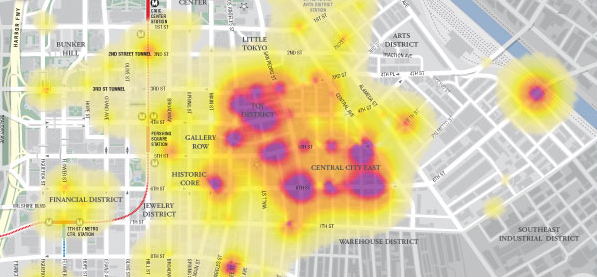
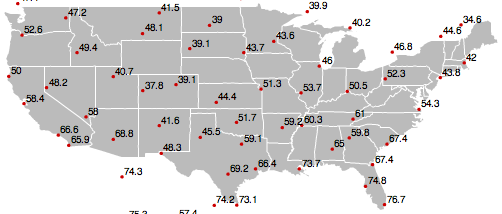
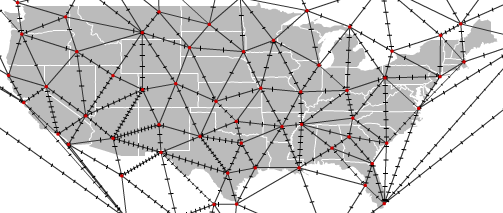
So, given a field of points (weather stations, say)…

weather stations

…with one or more attributes attached (temperature, say)…

weather stations for interpolation

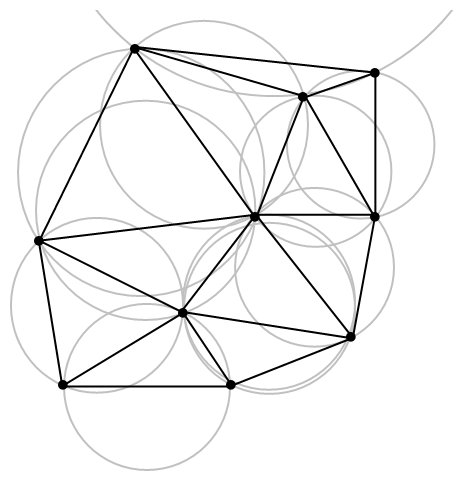
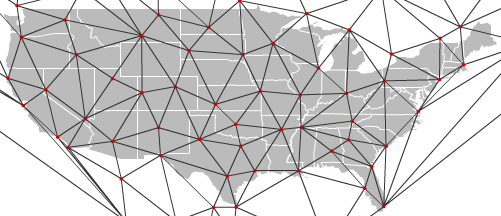
…a TIN can be constructed.

triangulated irregular network

With the above TIN, values can be interpolated along each edge between the points of known values (control points). The interpolation is strictly linear (that is, the value 50 would be interpolated halfway along an edge whose control points were valued 48 and 52).

interpolated points for isolining

With a given contouring interval (I’m using 4 degrees F here), we can connect some of these interpolated points, creating our contour lines.

rigid isolines, ready for smoothing

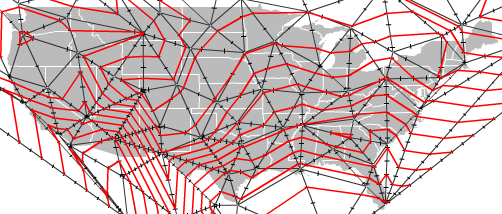
With the previous steps stripped away, this creates a passable isoline map.

masked isolines

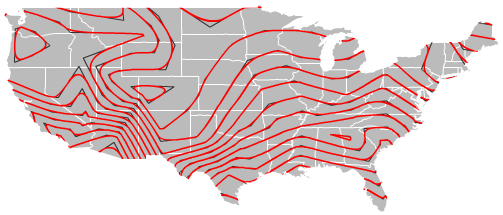
The lines are rigid, though, and should be smoothed for presentation. I allow two methods for this. You can use the “simple” method, which just uses the built-in graphics method curveTo between the midpoint of each isoline segment (below with the isoline interval decreased to 3 degrees).

simple curves for isolining

The above looks alright, but the curves are not continuous, closed loops can still have hard corners, and the isolines no longer pass through the interpolated points (we have therefore generalized an already-inaccurate interpolation). My compatriot Andy Woodruff, author of the glorious new Cartogrammar blog, offered to write a nice continuous curve method that ensured isolines would still pass through the interpolated values. You can read about the method in his post. Here she blows:

continuous curves for isolining

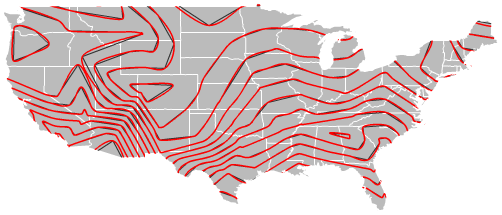
Bringing it all together, then, and incorporating the only extra feature I wrote (tinting of isolines), here’s a nice finished isoline map of temperature across the U.S.

finished isoline map of U.S. temperature

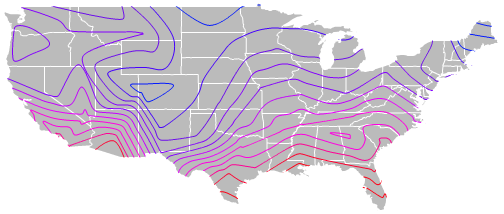
My new isolining package for Flash/ActionScript3 accomplishes all of the above, requiring only an array of point data with attribute values attached. The above example, was accomplished with the following lines of code (after drawing the U.S. states from a shapefile).

//first, generate the array of triangles (ITriangle objects) from the point data
var triangles:Array = Delaunay.triangulate(points);
Delaunay.drawDelaunay(triangles, points, triClip, false); //comment this out if you don't want to draw the triangulation
//generate an array of isolines (isoline objects)
var isos:Array = IsoUtils.isoline(triangles, points, triClip, 3, 0);
//create color and class arrays for tinting the isolines
var classesArray:Array = new Array(40, 44, 48, 52, 56, 60, 64, 68, 72, 76);
var colorsArray:Array = new Array(0x051CFD, 0x4602FD, 0x6D0EEB, 0x8400FF, 0xC400FF, 0xEA00FF, 0xFF00E2, 0xFF0095, 0xFF0030, 0xFF0015, 0xFB3507);
//then, actually draw them, using a continuous curve
IsoUtils.drawIsolines(isos, triClip, "continuous", colorsArray, classesArray, .5, .95);

The full example is included in the .zip distribution. Get that here:

  • the full .zip thing (in addition to my isolines class and an example, the archive includes my delaunay triangulation package, Andy Woodruff’s cubicBezier class, and a slightly modded version of Edvin van Rijkom’s shp classes, which are used to draw the shapefile in the example .fla)
  • or, for you browsers, the main IsoUtils.as class

Keep in mind: triangulation is just one interpolation method, and is many ways the least technical (and accurate). More accurate interpolation techniques include inverse-distance and kriging. ***If you’re having trouble, and your isoline interval is not an integer, check out the comment at line 171 of isoUtils.as. Please fix that, BTW.

I meant to add other features, but since I started work this past week, I’m posting the package as-is, and invite others to modify. On my wishlist:

  • hypsometric tinting, or color between the lines, would allow for more effective terrain or temperature mapping
  • support for projections and other coordinate conversions in the drawIsolines method. I have packages for converting lat/long to a number of map projections, but currently the drawIsolines method doesn’t have support for passing a point coordinate conversion method.
  • an animated demo. This thing’s lightning-fast, so why not?
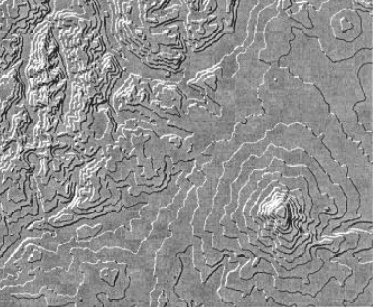
  • something that would be super wicked would be if someone would implement Tanaka’s illuminated contours [pdf] method, that thickens/thins and darkens/lightens lines like so…
    tanaka method
    …creating beautiful relief maps like the one below
    tanaka illuminated contours

If you add anything to the package, feel free to post a link to your revised version in the comments.

oh hey WordPress

Yeah I switched to WordPress, after being a (sometimes) proud Blosxom (specifically Blosxom.PHP) user for half a year.  It wasn’t an easy decision, especially as it required porting all my posts and comments, mostly manually, to WordPress, but after using it for just a few days I can tell it will be worth it.

Now there’s nothing wrong with Blosxom (well…), nor with other minimal blogware, but I gradually grew weary of the quirks (for example, it took me a weekend to debug the commenting functionality) and I began to feel like it was taking away from my writing.

What does this mean for you?

  • I’ve likely lost a lot of indie cred in your books.
  • If you subscribe, you’ll want to update your feed to this.
  • Outside links to individual blog posts won’t work. I can hopefully fix or redirect these eventually, but for now we’re all screwed.

On the bright side, you’re here, which means something’s working.

this is not a heat map

The term “heat map” has become increasingly confused. Perhaps it doesn’t matter, but for the record the above map is a choropleth map. It’s been branded by Google (as one of the Google Gadgets) with the sexier label “heat map”, and this (mis)usage is catching on. The term heat map is already equivocal. First, as a non-geographic, non-map representation, the heat map is a treemap-like graphical technique used to represent a two-dimensional array of data.

As a cartographer, though, I’ve always (well, ok, for a year or so anyway) taken heat maps to be a thematic mapping technique in which a (typically) diverging, (usually) thermal-like color scheme is used to represent density in a continuous fashion. Like the following (from Cartifact’s Downtown L.A. homeless map).

This technique holds the use of color (well, value or lightness really, not hue) in common with choropleth mapping. That is, they share the same visual variable (though, as noted, heat maps almost always utilize a diverging color scheme, in which both hue and value/lightness are varied). The difference is that choropleth maps represent data by enumeration units (countries, states, counties, blocks) while the heat map technique is continuous and not aggregated to enumeration units.

As I say, perhaps it doesn’t matter, and I’m not really advocating that Google Gadgets users (and others) learn the term “choropleth map”. Indeed, I’d be just as happy with the also-misleading term “color map”, as at least it does not already stand for two different symbologies.

delaunay triangulation in ActionScript 3

The Delaunay triangulation was invented in 1934 by Boris Delaunay. According to Paul Bourke,

The Delaunay triangulation is closely related geometrically to the Direchlet tesselation also known as the Voronoi or Theissen tesselations. These tesselations split the plane into a number of polygonal regions called tiles. Each tile has one sample point in its interior called a generating point. All other points inside the polygonal tile are closer to the generating point than to any other. The Delauney triangulation is created by connecting all generating points which share a common tile edge. Thus formed, the triangle edges are perpendicular bisectors of the tile edges.

What all that means is that the resultant triangles will be as equilateral as possible. The triangular mesh has the advantage of minimizing the distance over which interpolations must take place.

Go ahead, try it out.

With the idea of creating client-side isolines and inspired in part by the spirit of Keith Peters’ ongoing MathWorld Problem of the Week, I set out to write an AS3 class to create the above triangulation. After an hour of hacking, I gave up, and decided to just port the algorithm from another language. I chose Florian Jenett’s Java version, itself a port of Paul Bourke’s original C. The port was easy, and makes it a cinch to create a triangulation of, say, selected weather stations in the U.S.

(sorry - unprojected)

Of course, this triangulation isn’t really interesting in its own right, but rather for what it allows us to do, at run-time, with near real-time data, in Flash. On that, check this out.

(a temperature isoline map generated in Flash from a field of only 50 or so weather stations of the form lat, lon, temp)

I’ll release a full isolining package — complete with smoothing and hypsometric tinting — soon. For now, here’s the source code to the Delaunay triangulation in AS3.

filling the void

I defend my thesis next Tuesday, so have been staying away from here lately. I will return soon.

“Map” above is the USGS Rozel Point SW Quadrangle.